
Query Anything with DuckDB — From Live APIs to a Finished Report
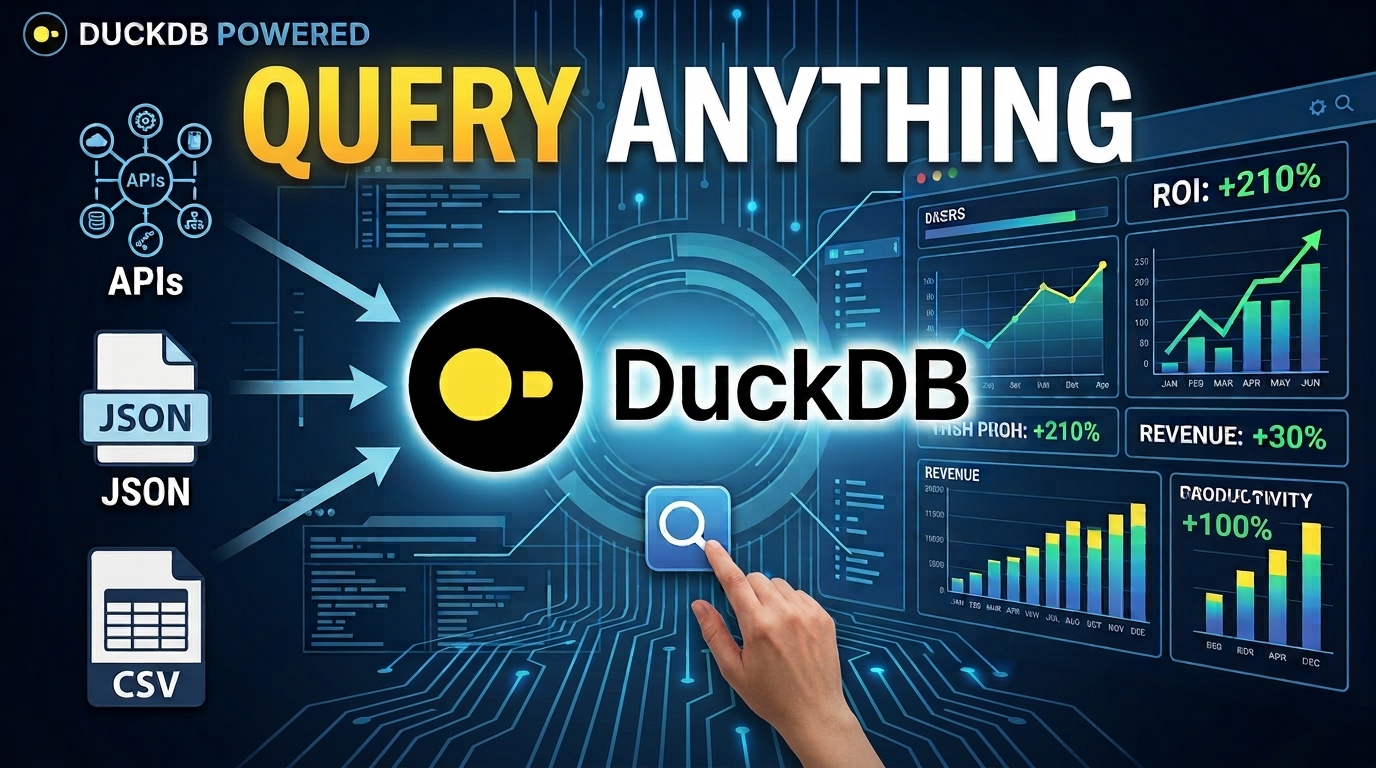
Most databases make you do the same thing first: load your data into them. DuckDB doesn't. Point it at a file, a folder of files or a URL, and you can query it with ordinary SQL, no import step.
To see how far that idea goes, I built a small project around it. It pulls JSON from live web APIs, joins the results in a local database, and turns them into an HTML report. The data happens to be stock prices and company filings, but the techniques work on almost any data. This post is about those techniques.
This article also includes a full video walkthrough:
The idea: the FROM clause accepts more than tables
DuckDB is an embedded, single-file database. There's no server and no connection string, just a library and a .duckdb file. What sets it apart is what you can put after FROM:
SELECT * FROM 'sales.csv';
SELECT * FROM read_parquet('data/*.parquet');
SELECT * FROM read_json_auto('https://www.sec.gov/files/company_tickers.json');
A CSV file, a whole folder of Parquet files (with a wildcard) and a JSON document on the web all behave like tables. You can SELECT, JOIN and GROUP BY across them in the same query. DuckDB can also attach other databases, such as SQLite and Postgres, through extensions, and the Python package can query a DataFrame in memory the same way.
For web data you need two extensions: httpfs, which lets DuckDB read from a URL, and json, which lets it treat JSON as a native SQL type. With both loaded, querying a file and querying an API become the same operation.
What I built
I used three live sources and no downloaded files:
| Source | What it returns | Table |
|---|---|---|
| Yahoo Finance chart API | A year of daily prices, as JSON | quotes |
| SEC ticker list | Every registered ticker and its company ID | tickers |
| SEC XBRL company-facts API | Four years of balance sheet figures | company_details |
The scripts join these: the company ID comes from tickers, and it's used to build the URL for the third source. A fourth script computes a technical indicator from the prices, and a short Python script renders everything into a report. Each loader creates its table if it doesn't exist and inserts only new rows, so any script is safe to re-run.
Five techniques that work on any API
Nearly all of the effort went into getting messy JSON into clean tables. These patterns are the reusable part.
1. Turn parallel arrays into rows with unnest. Yahoo returns one list of timestamps, one of opens, one of closes, and so on. unnest lines them up as rows:
SELECT
    CAST(to_timestamp(unnest(r.timestamp)) AS DATE) AS quote_date,
    unnest(r.indicators.quote[1].open)  AS open,
    unnest(r.indicators.quote[1].close) AS close
FROM raw;
2. Turn a keyed map into rows with map_values. The SEC ticker file is one big object keyed by position ("0", "1" and so on). Taking the map's values and unnesting them gives one row per company.
3. Read a document as a single value when the keys are dynamic. read_json_auto flattens the top level of a document into columns, which is handy until the keys vary by record. In the SEC filings data, each company has a different set of tagged concepts. read_json_objects returns the whole document as one JSON value, and json_extract with a path built from a variable pulls out any concept by name.
4. Send headers with an HTTP secret. Some APIs reject anonymous requests. The SEC does, and my first attempt failed with a bare HTTP error. A DuckDB secret attaches a header to every request in the session:
CREATE OR REPLACE SECRET sec_headers (
    TYPE http,
    EXTRA_HTTP_HEADERS MAP {'User-Agent': 'Your App your@email.com'}
);
5. Parameterize with variables. Set the input once, and build URLs from it:
SET VARIABLE target_ticker = 'MSFT';

SELECT * FROM read_json_auto(
    'https://query1.finance.yahoo.com/v8/finance/chart/'
    || getvariable('target_ticker') || '?range=1y&interval=1d'
);
Change one line and the same script loads a different company.
Habits that saved time
- Look before you write.
DESCRIBE SELECT * FROM read_json_auto('...')shows the schema DuckDB inferred. Most of my bugs were mismatches between what I assumed the JSON looked like and what it actually was. - Find the endpoint that returns data, not documents. I first reached for EDGAR's full-text search to get balance sheet numbers. It returns snippets and links to text. The XBRL API returns the actual values. If a search tool gives you pages, look for the sibling API that gives you fields.
- Make loads re-runnable. Load into a staging table, then insert only rows that aren't already in the target. It costs a few lines and means you never fear running a script twice.
- Expect data to vary. Filings repeat last year's figures as comparisons, and companies tag some items differently. A window function keeps the right row, and a fallback covers the awkward cases. It's better to leave a value blank than to invent one.
It's still real SQL
Once the data is in tables, everything else DuckDB offers is available. I computed a Relative Strength Index, a common momentum indicator, with a recursive query, because each day's average depends on the previous day's:
WITH RECURSIVE rsi_calc AS (
    SELECT symbol, rn, avg_gain_sma AS avg_gain, avg_loss_sma AS avg_loss
    FROM seed WHERE rn = 10
    UNION ALL
    SELECT g.symbol, g.rn,
           (r.avg_gain * 8 + g.gain) / 9,
           (r.avg_loss * 8 + g.loss) / 9
    FROM rsi_calc r
    JOIN gains_losses g ON g.symbol = r.symbol AND g.rn = r.rn + 1
)
A fast line and a slow line, with a window function to detect where they cross, gave 38 crossover points for Microsoft over a year. The point isn't the indicator. It's that window functions, CTEs and recursion all work on data that arrived from a URL a few seconds earlier.
The last step: Python for the page
SQL is great at getting and shaping data, but it can't lay out a styled page. A short Python script opens the database read-only, runs three queries for a ticker, and drops the results as JSON into an HTML template. The output is a single file you can open in any browser. To refresh it, re-run the loaders and then the script.
Try it yourself
You need only the DuckDB command line. Pick any JSON API you can call without a key, and run:
INSTALL httpfs; LOAD httpfs;
INSTALL json; LOAD json;

DESCRIBE SELECT * FROM read_json_auto('https://your-api-url-here');
Once you see the columns, unnest whatever is nested, put the result in a table, and you have a small pipeline.
Takeaways
- In DuckDB,
FROMcan point at files, folders and URLs, not only tables. - Most of the work is reshaping nested JSON, and
unnest,map_valuesandjson_extractcover most cases. - Secrets handle headers and variables handle parameters, so scripts stay short and reusable.
- Once the data is in tables, the whole SQL toolbox applies.
The financial examples here illustrate the technique and aren't financial advice.