
Build a Real-Time SQL Dashboard with n8n and amCharts (No Backend Required!)
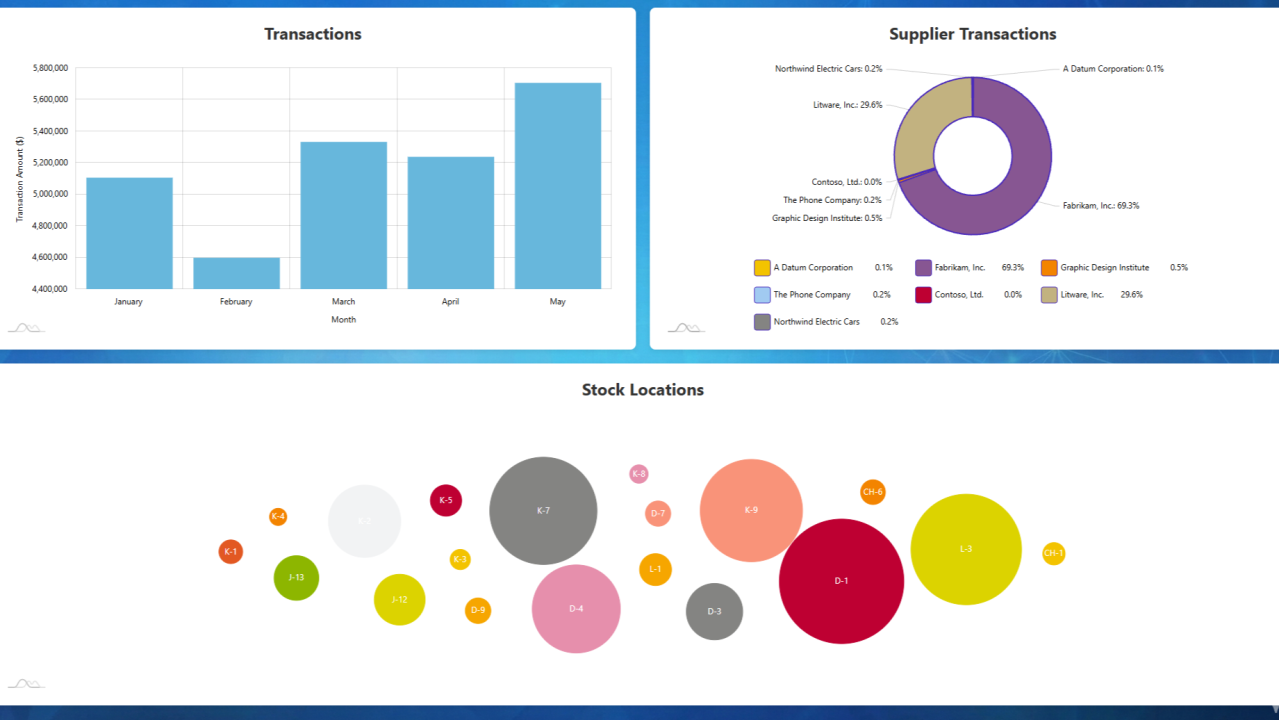
Have you ever wanted to create a beautiful, interactive dashboard but dreaded the thought of setting up servers, APIs, and all that backend infrastructure? What if I told you that you could build a production-ready business intelligence dashboard using just workflow automation?
In this tutorial, I'll show you how to create a dynamic, data-driven dashboard that queries your SQL Server database and displays stunning visualizations — all through a single n8n workflow. No traditional backend development required.
What We're Building
By the end of this tutorial, you'll have an automated dashboard that:
- Queries live data from SQL Server (customer transactions, inventory, suppliers)
- Aggregates and formats data automatically
- Generates interactive charts using amCharts
- Serves everything as a responsive HTML page
- Updates in real-time whenever someone visits the URL
- Includes a custom background image for that professional touch
The best part? It all runs through a single webhook endpoint — just visit the URL and boom, your dashboard appears.
Why n8n for Dashboards?
Traditional dashboards require setting up backend servers, REST APIs, authentication layers, and a whole lot of infrastructure. With n8n, we're treating the workflow itself as our backend. The workflow:
- Receives HTTP requests
- Fetches data from multiple sources in parallel
- Transforms and aggregates the data
- Generates HTML with embedded visualizations
- Returns everything in one response
It's elegant, maintainable, and surprisingly powerful.
Prerequisites
Before we dive in, make sure you have:
- An n8n instance (self-hosted or cloud — either works)
- Access to a SQL Server database with sample data
- Basic familiarity with SQL queries
- (Optional) A background image for your dashboard
I'm using the WideWorldImporters sample database for this tutorial, but you can adapt the queries to any SQL Server database you have access to.
Step 1: Setting Up the Webhook Trigger
Every great dashboard needs an entry point. In n8n, that's the Webhook node.
Add a Webhook node to your canvas (this is where your workflow begins) and configure these settings:
- HTTP Method: GET (we're serving content, not accepting form data)
- Path: You can generate a random UUID or use something memorable
- Response Mode: "Respond to Webhook" (critical — we'll handle the response later)
- Raw Body: Enable this in Options
- Response Headers: Add a header with Name
content-typeand Valuetext/html
This creates a publicly accessible URL. When someone visits it, n8n fires up your workflow and serves the dashboard.
Pro tip: Save your webhook URL somewhere safe — you'll need it to test your dashboard!
Step 2: Querying Your Data (The Parallel Approach)
Here's where things get interesting. Instead of querying databases one after another (slow!), we're going to fire off multiple queries simultaneously. This is the power of n8n's parallel execution.
Query 1: Customer Transactions by Month
Connect a Microsoft SQL node directly to your Webhook trigger.
Configuration:
- Name:
Microsoft SQL - Customer Transactions - Operation: Execute Query
SELECT
    YEAR(TransactionDate) AS Year,
    MONTH(TransactionDate) AS Month,
    DATENAME(MONTH, TransactionDate) AS MonthName,
    SUM(TransactionAmount) AS TotalTransactionAmount
FROM [WideWorldImporters].[Reports].[CustomerTransactionsView]
WHERE YEAR(TransactionDate) = 2016
    AND TransactionAmount > 0
GROUP BY
    YEAR(TransactionDate),
    MONTH(TransactionDate),
    DATENAME(MONTH, TransactionDate)
ORDER BY
    MONTH(TransactionDate);
This gives us monthly transaction totals — perfect for a column chart showing revenue trends over time.
Query 2: Inventory by Stock Location
Add another Microsoft SQL node, also connected to the Webhook (yes, both nodes connect to the same trigger — that's how we create parallel branches).
Configuration:
- Name:
Microsoft SQL - Stock Locations
SELECT
    BinLocation as name,
    SUM(LastStocktakeQuantity) AS value
FROM [WideWorldImporters].[Warehouse].[StockItemHoldings]
WHERE LastEditedWhen = '2016-05-31 07:00:00.0000000'
GROUP BY BinLocation
ORDER BY BinLocation;
This data will power a force-directed network chart showing how inventory is distributed across warehouse locations.
Query 3: Supplier Transaction Counts
Add a third Microsoft SQL node (again, connected to the Webhook).
Configuration:
- Name:
Microsoft SQL - Supplier Transactions
SELECT
    s.SupplierName as name,
    COUNT(*) AS value
FROM [WideWorldImporters].[Warehouse].[StockItemTransactions] t
INNER JOIN [WideWorldImporters].[Purchasing].[Suppliers] s
    ON t.SupplierID = s.SupplierID
GROUP BY s.SupplierID, s.SupplierName
Perfect for a donut chart showing which suppliers you work with most frequently.
What just happened? When the webhook triggers, all three SQL queries fire simultaneously. This parallel execution is way faster than sequential queries.
Step 3: Aggregating Your Data Streams
Each SQL query returns multiple rows, but we need to collect them into arrays for our charts. That's where Aggregate nodes come in.
After each SQL query node, add an Aggregate node:
- Customer Transactions — Aggregate: "Aggregate All Item Data", Destination Field Name:
customerTransactions - Stock Locations — Destination Field Name:
stockLocations - Supplier Transactions — Destination Field Name:
supplierTransactions
These nodes take all the rows from each query and bundle them into a single JSON array. Think of it as collecting all your puzzle pieces into one box before you start assembling.
Step 4: Adding a Background Image (Optional but Awesome)
Want your dashboard to look professional? Let's add a custom background. This creates a fourth parallel branch:
- Add a "Read Binary File" node (connect it to the Webhook). File Path: point to your image (e.g.,
/usr/share/misc/sales-dash/dashboard.png). Store your image somewhere accessible to your n8n instance. - Add a Code node after the Read Binary File node. Mode: Run Once for All Items.
// Get the binary data from the previous node
const binaryData = $input.all()[0].binary.data;

// Extract the base64 string
const base64String = binaryData.data;

// Create a data URL that can be embedded in HTML
const dataUrl = `data:image/png;base64,${base64String}`;

return [{
  json: {
    bgImage: dataUrl
  }
}];
This converts your image to a base64 data URL, which we can embed directly in our HTML without needing to serve it separately.
Step 5: Merging All Data Streams
Now we have four parallel branches flowing with data. Time to bring them together.
Add a Merge node:
- Mode: "Merge By Position"
- Number of Inputs: 4
Connect your four aggregate/code nodes:
- Input 1: Aggregate - Customer Transactions
- Input 2: Aggregate - Stock Locations
- Input 3: Aggregate - Supplier Transactions
- Input 4: JS - Get Background (the Code node output)
This creates a single data object containing all four datasets, perfectly aligned and ready to use.
Step 6: Final Data Structure
Add one more Aggregate node after your Merge node:
- Name:
Aggregate - Merged Data - Aggregate: "Aggregate All Item Data"
This creates a clean, single JSON object with all your data in one place. Your HTML template will access it as $json.data[0], $json.data[1], etc.
Step 7: Generating the HTML Dashboard
This is where the magic happens. We're going to create a complete, interactive HTML page with embedded charts.
Add an HTML node and paste this code:
<html>
<body>
<style>
  body {
    font-family: -apple-system, BlinkMacSystemFont, "Segoe UI", Roboto, Helvetica, Arial, sans-serif;
    font-size: 9pt;
    margin: 0;
    padding: 20px;
    background-image: url('{{ $json.data[3].bgImage }}');
    background-size: cover;
    background-position: center;
    background-repeat: no-repeat;
    background-attachment: fixed;
  }

  .chart-container {
    display: flex;
    flex-wrap: wrap;
    width: 100%;
    gap: 20px;
  }

  .chart-wrapper {
    flex: 0 0 calc(50% - 10px);
    max-width: calc(50% - 10px);
    background-color: #ffffff;
    border-radius: 8px;
    box-shadow: 0 2px 8px rgba(0, 0, 0, 0.1);
    padding: 20px;
    box-sizing: border-box;
  }

  .chart-wrapper:nth-child(3) {
    flex: 0 0 100%;
    max-width: 100%;
  }

  .chart-title {
    text-align: center;
    font-size: 18pt;
    font-weight: bold;
    margin-bottom: 20px;
    color: #333;
  }

  #chartdiv, #piechartdiv, #forcechartdiv {
    width: 100%;
    height: 400px;
  }
</style>

<script src="//cdn.amcharts.com/lib/4/core.js"></script>
<script src="//cdn.amcharts.com/lib/4/charts.js"></script>
<script src="//cdn.amcharts.com/lib/4/themes/animated.js"></script>
<script src="//cdn.amcharts.com/lib/4/plugins/forceDirected.js"></script>
<script src="//cdn.amcharts.com/lib/4/themes/kelly.js"></script>

<div class="chart-container">
  <div class="chart-wrapper">
    <div class="chart-title">Transactions</div>
    <div id="chartdiv"></div>
  </div>

  <div class="chart-wrapper">
    <div class="chart-title">Supplier Transactions</div>
    <div id="piechartdiv"></div>
  </div>

  <div class="chart-wrapper">
    <div class="chart-title">Stock Locations</div>
    <div id="forcechartdiv"></div>
  </div>
</div>

<script type="text/javascript">
am4core.useTheme(am4themes_animated);
am4core.useTheme(am4themes_kelly);

// Column Chart - Customer Transactions
var chart = am4core.create("chartdiv", am4charts.XYChart);
chart.marginRight = 400;
chart.data = {{ $json.data[0].customerTransactions.toJsonString() }}

var categoryAxis = chart.xAxes.push(new am4charts.CategoryAxis());
categoryAxis.dataFields.category = "MonthName";
categoryAxis.title.text = "Month";
categoryAxis.renderer.grid.template.location = 0;
categoryAxis.renderer.minGridDistance = 20;

var valueAxis = chart.yAxes.push(new am4charts.ValueAxis());
valueAxis.title.text = "Transaction Amount ($)";

var series = chart.series.push(new am4charts.ColumnSeries());
series.dataFields.valueY = "TotalTransactionAmount";
series.dataFields.categoryX = "MonthName";
series.name = "Total Transactions";
series.tooltipText = "{name}: [bold]${valueY.formatNumber('#,###.00')}[/]";
series.columns.template.fill = am4core.color("#67b7dc");
series.columns.template.stroke = am4core.color("#67b7dc");

chart.cursor = new am4charts.XYCursor();

// Pie Chart - Supplier Transactions
var pieChart = am4core.create("piechartdiv", am4charts.PieChart);
pieChart.data = {{ $json.data[2].supplierTransactions.toJsonString() }}

var pieSeries = pieChart.series.push(new am4charts.PieSeries());
pieSeries.dataFields.value = "value";
pieSeries.dataFields.category = "name";
pieChart.innerRadius = am4core.percent(40);
pieSeries.slices.template.stroke = am4core.color("#4a2abb");
pieSeries.slices.template.strokeWidth = 2;
pieSeries.slices.template.strokeOpacity = 1;
pieChart.legend = new am4charts.Legend();

// Force-Directed Chart - Stock Locations
var forceDirected = am4core.create("forcechartdiv", am4plugins_forceDirected.ForceDirectedTree);
var forceDirectedSeries = forceDirected.series.push(new am4plugins_forceDirected.ForceDirectedSeries())
forceDirectedSeries.data = {{ $json.data[1].stockLocations.toJsonString() }}
forceDirectedSeries.dataFields.name = "name";
forceDirectedSeries.dataFields.id = "name";
forceDirectedSeries.dataFields.value = "value";
forceDirectedSeries.nodes.template.label.text = "{name}"
forceDirectedSeries.nodes.template.tooltipText = "{value}";
</script>
</body>
</html>
What's Happening Here?
- Responsive Layout — the CSS creates a flexible grid that adapts to screen size.
- Three Chart Types — column chart for transaction trends, donut chart for supplier distribution, force-directed network for stock locations.
- Data Injection — n8n's template syntax (
{{ $json.data[0].customerTransactions.toJsonString() }}) embeds your SQL data directly into the JavaScript. - Interactive Features — amCharts provides tooltips, legends, and smooth animations automatically.
Step 8: Sending the Response Back
Almost done! We need to actually send this HTML to the browser.
Add a "Respond to Webhook" node:
- Respond With: "Text"
- Response Body:
={{ $json.html }}
Connect the HTML node to this Respond to Webhook node. This tells n8n to send the generated HTML back to whoever requested the webhook URL.
Step 9: Activate and Test
- Connect the HTML node to the Respond to Webhook node.
- Review your workflow — you should see four parallel branches converging into the merge node, then flowing through aggregate → HTML → respond.
- Activate the workflow using the toggle switch in the top-right corner.
- Test it! Copy your webhook URL and open it in a browser.
If everything is set up correctly, you should see your beautiful dashboard with three interactive charts, all pulling live data from your SQL Server database.
Understanding the Workflow Architecture
Let's step back and appreciate what we've built:
Webhook Trigger
    ├─→ SQL Query 1 → Aggregate 1 ─┐
    ├─→ SQL Query 2 → Aggregate 2 ─┤
    ├─→ SQL Query 3 → Aggregate 3 ─┼─→ Merge → Final Aggregate → HTML → Respond
    └─→ Read Image → Convert Base64 ┘
This architecture has several advantages:
- Parallel Execution — all data fetches happen simultaneously, minimizing latency.
- Single Response — everything (data, visualizations, styling) returns in one HTTP response.
- No Database Required — n8n doesn't need to cache or store anything, it's just a smart proxy.
- Instant Updates — every page load queries fresh data from SQL Server.
Customization Ideas
Now that you have the foundation, here are ways to make it your own.
Change the data. Adapt the SQL queries to your database schema — sales by region, employee performance metrics, website analytics, inventory turnover rates, customer satisfaction scores.
Switch up the charts. amCharts supports dozens of chart types: line charts for time-series trends, heatmaps for geographic data, Sankey diagrams for flow visualization, radar charts for multi-dimensional comparisons. Check out the amCharts documentation for examples.
Add filters and parameters. You could modify the webhook to accept query parameters — ?year=2024 to filter by year, ?region=west to show regional data, ?top=10 to limit results. Access these in n8n using {{ $json.query.year }} in your SQL queries.
Implement security. For production dashboards, consider HTTP Basic Auth on the webhook node, IP whitelisting if your n8n instance supports it, and time-based tokens in the URL that expire.
Schedule data refreshes. While this dashboard queries live data, you might want to cache results for performance. Add a Schedule Trigger that runs your queries every hour and stores results in n8n's built-in data store or an external cache like Redis.
Mobile optimization. The CSS includes basic responsiveness, but you could stack charts vertically on small screens, add touch-friendly interactions, and implement progressive loading for charts.
Troubleshooting Common Issues
Charts aren't rendering. Check: open your browser's developer console (F12) and look for JavaScript errors. Fix: ensure amCharts CDN scripts are loading — check your internet connection or consider hosting amCharts locally.
No data appearing. Check: look at the n8n execution log — did the SQL queries return results? Fix: verify database credentials, table names, and that your queries return data when run directly in SQL Server Management Studio.
Background image not showing. Check: is the file path correct? Does n8n have read permissions? Fix: use an absolute path — if using Docker, ensure the path is mounted in the container.
Merge node errors. Check: are all four branches reaching the merge node? Fix: ensure each branch has an aggregate node and that connections are solid (no red indicators).
Webhook returns error 500. Check: examine the workflow execution history in n8n. Fix: look for the specific node that failed — often it's a missing field reference or typo in the HTML template.
Performance Considerations
Database query optimization. Your dashboard is only as fast as your slowest query. Make sure indexes exist on frequently queried columns (especially date fields), you're not doing full table scans on large tables, and aggregations happen in the database, not in n8n.
Caching strategy. If your dashboard sees heavy traffic, add a Cache node in n8n to store query results, set a TTL based on how fresh your data needs to be, and return cached results for subsequent requests within the TTL window.
CDN considerations. We're loading amCharts from their CDN, which is fast and reliable. But for critical applications, consider hosting amCharts files yourself, using a CDN with guaranteed uptime SLAs, and implementing a fallback to local copies if the CDN fails.
Real-World Use Cases
This pattern isn't just for SQL dashboards. You could adapt it for:
- API aggregation dashboards — query multiple REST APIs (Stripe, Google Analytics, Salesforce) in parallel and display unified metrics.
- IoT monitoring — pull data from sensors, weather APIs, and device logs to create a real-time monitoring dashboard.
- Marketing reports — combine data from ad platforms, email campaigns, and website analytics into one executive summary.
- Financial tracking — monitor stock prices, crypto values, and portfolio performance with live updates.
Taking It Further
Once you've mastered this basic dashboard, consider:
- Adding user authentication — implement OAuth or JWT tokens so different users see different data based on their permissions.
- Creating a dashboard library — build multiple dashboard workflows and create an index page that links to them all.
- Exporting to PDF — add a node that renders the HTML to PDF using a service like Puppeteer, then emails it on a schedule.
- Adding alerts — set up conditional logic that sends notifications (email, Slack, SMS) when metrics cross certain thresholds.
- Building a dashboard API — instead of returning HTML, return JSON, then build a separate React or Vue frontend that consumes your n8n workflow as a backend API.
Conclusion
You've just built a production-ready business intelligence dashboard using n8n workflow automation. No traditional backend, no server management, no complex deployment pipelines — just a workflow that queries data, generates visualizations, and serves everything through a single URL.
This is the power of treating workflows as infrastructure. n8n becomes your backend, your API layer, and your rendering engine all in one. Whether you're a solo developer, a small team, or just someone who wants to quickly visualize data without the overhead of traditional development, this approach offers incredible flexibility.
The best part? Everything we've built here is extensible. Need more data sources? Add another parallel branch. Want different visualizations? Swap out the amCharts code. Need to support mobile? Tweak the CSS. The workflow architecture we've created can scale from simple personal dashboards to complex enterprise reporting systems.
Now it's your turn — what data will you visualize?